 Forests affected by insect epidemics, spruce budworm (SBW) in this case, have a heterogeneous stand structure due in part to their defoliation level, which is not necessarily the same from tree to tree. Harvesting these stands entails additional costs stemming from lost machine productivity due to the additional time required to produce a product mix that meets mills’ specifications. In addition, recent remote sensing developments have shown great potential for detailed, accurate maps that can enhance the planning and deployment of forest operations. It is in this context that studies have been conducted on the Quebec North Shore since 2014 in order to measure lost machine productivity and develop finer mapping to guide operators to areas where stem value ensures the sustainability of operations.
Productivity model based on stem vigour
A productivity model based on stem vigour was developed by measuring the time required to process stems based on their level of degradation. A stand’s dendrometric characteristics (species, DBH) were obtained from a pre-treatment forest inventory. The level of tree degradation was assessed by using the different states of decomposition by Hunter (Figure 1). Detailed time studies were subsequently carried out and combined with on-board computer data.
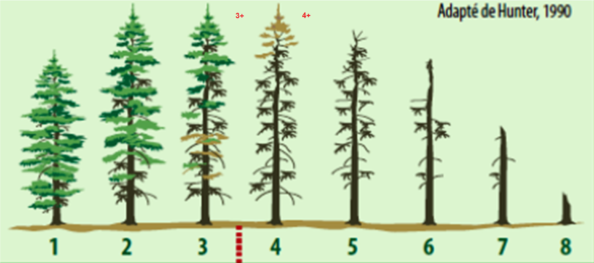
Figure 1: Illustration of the different states of decomposition by Hunter.
The studies indicated that productivity decreased when stems were 16 cm in diameter or more and were classified as H3+ (Figure 2). Of course, productivity decreases as stems deteriorate. This study has the advantage of making it possible to quantify lost productivity and the impact on harvesting costs.
|
Relative productivity |
H3 |
H3+ |
H4 |
H4+ |
|
Small (10-14 cm) |
100.0% |
100.0% |
78.7% |
6.0% |
|
Medium (16-20 cm) |
100.0% |
83.6% |
34.6% |
7.6% |
|
Large (22 cm+) |
100.0% |
66.4% |
59.6% |
0.0% |
Figure 2: Productivity reduction table based on stand structure and stem vigour.
Stem vigor map
A drone fitted with an infra-red imaging system flew over infested stands so that better harvesting cost projections could be prepared based on the degree of stem defoliation. The data were analyzed and corroborated with the different states of decomposition by Hunter (Figure 1), making it possible to precisely map trees based on their vigour (Figure 3). Such a map is a planning and deployment tool for recovery as it indicates the areas where productivity will be severely reduced.
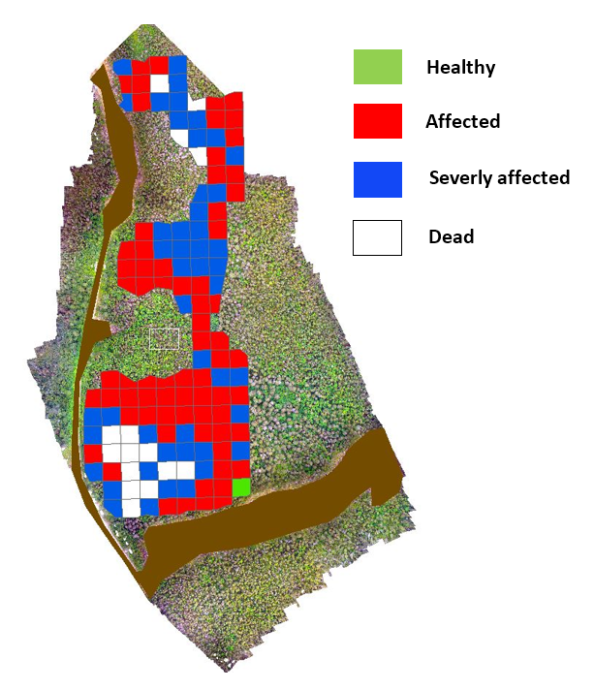
Figure 3: Stem vigour map.
Harvesting map
Assisted navigation tests have been conducted for a few years now in heterogeneous stand conditions. Maps made using LiDAR data, more specifically the canopy model (tree height), have identified microstands (20 m x 20 m) based on their structure and fine-tuned the silviculture prescription. These harvesting maps (Figure 4) optimize the trail network by avoiding unproductive sectors and give operators simple stem-selection rules for harvesting based on microstands.
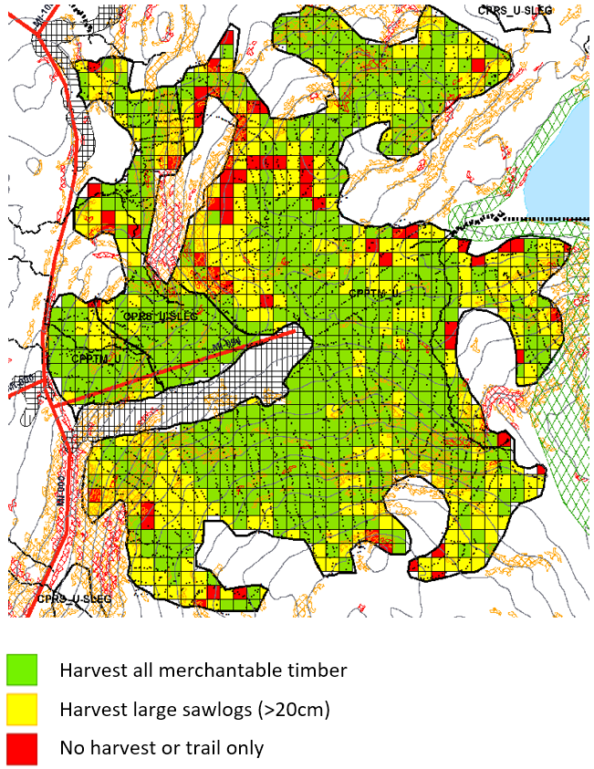
Figure 4: Sample harvesting map.
Winning combination
A combination of the three above-mentioned tools must still be developed; however, all indicators are that it would be a winning combination because it would guide operators to areas where stem value would ensure the sustainability of operations, avoid sectors where stems are too degraded to be recovered, and provide felling rules that take into account machine productivity based on stem vigour.
For more information, contact Jean-Philippe Gaudreau at jean-philippe.gaudreau@fpinnovations.ca.