 The headline numbers coming out of the U.S. continue to point to a robust economy, but the K-shaped bifurcation between income brackets is undeniable.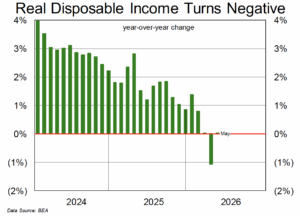
The steady decline (and recent collapse) in real disposable income is concerning. There are many factors that contribute to an individual’s disposable income. Rising energy costs have been a big factor of late (gas prices predominantly), but disposable income was in decline far before its recent dip into negative territory. Inflation has outstripped wage growth in many parts of the private sector, with households often having to tap into savings and/or take on debt to support spending. Another challenge has been high interest rates, and that shows up in the housing market (as well as autos).
For housing, The Wall Street Journal recently highlighted how homeownership costs are rising faster than CPI. From 2019 to 2025 the CPI was up 26% while the total cost of homeownership rose 39%. Interest costs were the biggest single cost of homeownership. Looking to the outlook for interest rates, the appointment of Kevin Warsh as Fed chair has many expecting a more hawkish Fed and odds are the next move will be a rate hike (likely in December as doing anything before the mid-terms could be fraught with political overtones). Elevated inflation and interest rates may be the new normal…that is until a recession hits and corrects some imbalances.
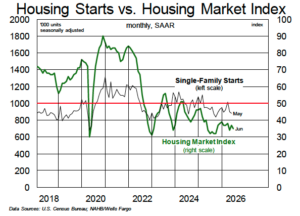 After showing impressive resilience through the first four months of the year, U.S. housing starts capitulated in May, slumping to a seasonally adjusted 1.18MM units (their lowest level since May 2020 at the onset of the pandemic). Single-family starts came in at 882,000, off by 2% m/m and 7% y/y, while multifamily activity was off by a whopping 40% m/m and 14% y/y at just 295,000. That adjusted multifamily number was the lowest reading since November 2024 and came as a shock after multis had decisively outperformed singles through the first four months of the year (averaging an adjusted 478,000 over that period).
On an unadjusted basis, May starts data were equally grim, with total starts of 107,000 down 16% m/m and 9% y/y. Unadjusted singles of ~82,000 marked a decline of just 1% m/m and 7% y/y, but multis, at just 25,000, were down 43% m/m and 16% y/y. Looking at permits, the trend was also negative, albeit nowhere near as bad as starts: Adjusted permits declined by 1% m/m and were unchanged y/y at 1.41MM.
To round off a dismal month, home sales data for May gave little reason for optimism. Looking first at new home sales, May’s total of 580,000 (adjusted) was off 7% both m/m and y/y. On the back of sluggish sales, for-sale inventory at the end of May increased to an adjusted 496,000 units (the highest level in almost 12 months) or 10.3 months of sales-adjusted supply (a 17-year high!). This pullback in new home sales and the resultant inventory build will undoubtedly force homebuilders to throttle back on new home starts over the coming months. The glut of unsold inventory on the market was top of mind for many builders coming into 2026 and, five months later, little-to-no progress has been made on working this down.
Existing home sales for May were perhaps the brightest spot last month, with an adjusted 4.17MM sales representing an increase of 3% both m/m and y/y. Existing sales have averaged 4.07MM through the first five months of the year, virtually in line with last year’s average. Modest mortgage rate relief will be required if existing home sales are to move meaningfully higher in the second half of 2026.